Typing "pave" launches a "wrapper script", which in turn fires up the software bus and the PAVE executable itself. The PAVE executable itself should never be launched directly from the command line, as this wrapper script is required to set up PAVE's environment.
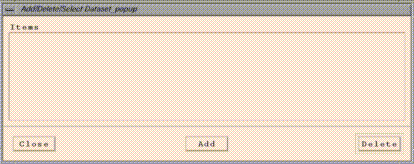
Click on its "Add" button, and an EDSS file browser should appear:
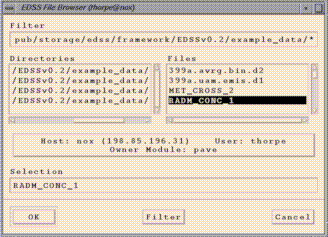
(this may take a couple seconds). The file browser has a "Filter" widget at the top. You can see the files in a particular directory by typing or pasting in the directory name and adding a "/*" at the end and hitting return. Alternatively, you can navigate through the directory structure by double clicking on directories in the Directories list (or single clicking and hitting return). Once you get to the directory that contains the file you want, you can select the file by clicking on it in the Files list.
Use the file browser to add the file
"<top level PAVE directory>/example_data/RADM_CONC_1"(If RADM_CONC_1 is not available, choose any dataset in the directory.) This will become PAVE's dataset "a", and this will be the currently selected dataset. Do the same with
"<top level PAVE directory>/example_data/399a.uam.emis.d1"which will become dataset b.
There may be several other example datasets in <top level PAVE directory>/example_data that you may want to play around with, although some may be missing due to disk space considerations:
   -rw-r--r--   1 thorpe   edss     8549788 Aug 17 09:26 399a.avrg.bin.d2
   -rw-r--r--   1 thorpe   edss     1070068 Aug 17 09:27 399a.uam.emis.d1
   -rw-r--r--   1 thorpe   edss    11870588 Aug 17 09:29 MET_CROSS_2
   -rw-r--r--   1 thorpe   edss    11870584 Aug 17 09:30 RADM_CONC_1
   -rw-rw-r--   1 thorpe   edss     7871036 Aug 17 09:32 bot_west_chem_ec1_g0
   -rw-r--r--   1 thorpe   edss      201048 Aug 17 09:32 exact1
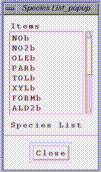
This should now be displaying the species available in dataset b, the currently selected dataset.
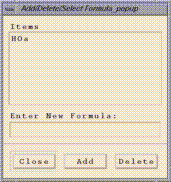
Add item "HOa+HO2a" in the "Enter New Formula:" typein box and click on "Add". Add "NOb" and "O3a" as well. You now have a total of four formulas added to your formula list, and O3a is the currently selected formula.
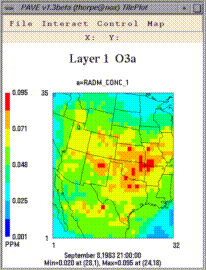
"Graphics/Create Tile Plot"
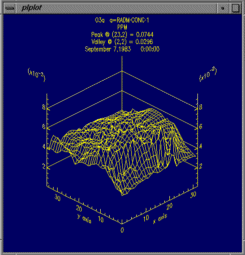
 "Graphics/Create 3d Mesh Plot"
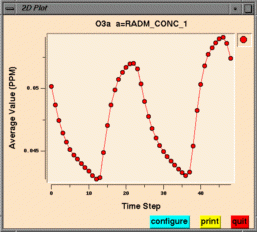
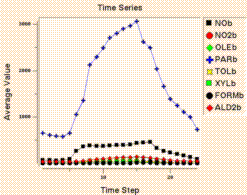
 "Graphics/Create Time Series Line Plot"
 "Graphics/Create Time Series Bar Plot"
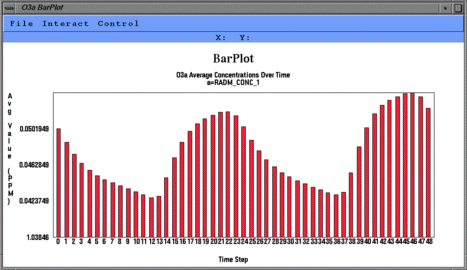
NOTE: All the plots above are associated with the selected
formula, which is probably O3a. The selected formula
can be modified with the "Formulas menu/ Edit/Select from Formula List"
window.
The tile plot and mesh plot show data for the selected region at a particular time step, and can be animated to show other time steps. The time series line and bar plots show data averaged over the selected region at each time step. Here are some things to try with the plots:
- If you want to adjust a tile plot's legend min/max cutoffs,
choose "Control/Configure" from the plot's menu bar.
- If you want to animate a tile plot over time, select
the "Control/Animate" menu item on a tile plot. This
brings up a window from which you can start the
animation.
- If you want to animate all existing tile plots synchronously,
select the "Graphics/Animate Tile Plots Synchronously" menu
item from the main PAVE window. This presents a window
that you can use to start the animations.
- When using a slider (such as in the Animate window for Tile Plots), to scroll by one time step in either direction, click on the slider itself and then use the left and right arrow buttons on the keyboard.
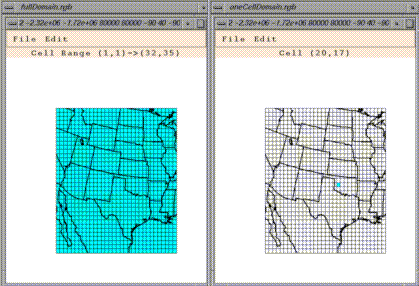
By default, the entire domain is selected for any dataset/formula loaded into PAVE. This is indicated by a light blue background on all of the cells in the domain window. You may want to do a time series of a single cell, or perhaps a tile plot of a smaller region of cells. To subselect a region, just left-click-and-drag over any blue areas to deselect cells, and conversely over any white areas to select cells. Also, you can use the Edit menu's "Select All" and "Select None" items to turn all the cells in the domain on or off. Subsequent plots will show data only from the subselected region.
This window can be closed using the File menu's "Close" item. Also note the File menu's "Save Domain To File" and "Load Domain From File" menu items that allow you to save and later retrieve frequently used domain subselections.
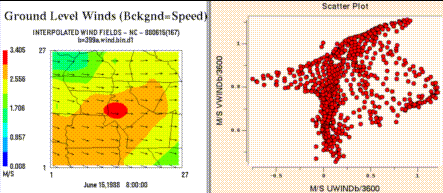
- The background map can be toggled between county boundaries, medium (the default map) or high resolution state boundaries, rivers, or roads.
- Tile plots can be printed, or saved as PostScript, XWD, RGB, or Gif images.
- You can zoom in on, probe the data values in, and generate time
series plots for specific regions of tile plots.
After selecting the layers you want to see, type a statement of the following form into PAVE's standard input:
-subdomain 80 20 80 90
Here the arguments to -subdomain are: x1 y1 x2 y2 to define the region to be selected. This will cause the data where x = 80, and y is between 20 and 90 to be selected. To see this region on the screen (and/or to set this region using the User Interface rather than a command line option), you can choose "Select Regions of Interest Matching Current Dataset". A window showing the domain will come up. Alternatively, you can select the cells with the mouse, but this gets difficult when grid cells are small and you want to select a very precise area.
Now that the layers and region to be plotted are selected, you need to set the cross section type. Under the Graphics menu, choose "Set Tile Plot Cross Section Type" and you will see a submenu of X, Y, or Z cross sections. To make a plot for the above example choose "X Cross Section" (remember this by noting that x is constant). Next, draw the plot for a formula using that dataset by choosing "Create Tile Plot" from the Graphics menu, and you will see the plot of that cross section.